

The majority on the Pima County Board of Supervisors repeats the mantra that the cost of the new bonds to residents is little more than the cost of a latte. They ignore the hit commercial property owners will take and want the public to ignore the upward trajectory of Projected Tax Rate per $100 Taxable Net Assessed Value.
Commercial property owners are painfully aware of the hit they are about to take on two levels; one being the increase in taxes, and two being competition with the County for renters as the County develops more commercial buildings for various “economic development” items in the proposed bond package.
Related article: Pima County Administrator Claims Verifying Elections Is A Crime
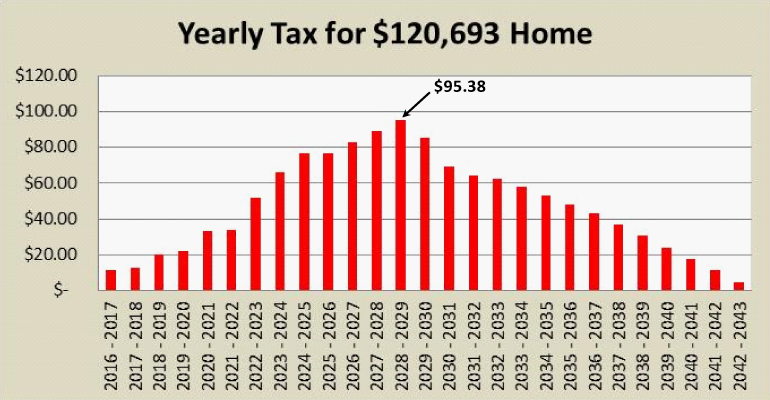
Residents, however do not follow the money as closely as those in the business of making money through commercial properties. As a result, they may not be aware of the all the facts. Residents are told in the voters’ pamphlet that they will pay $0.3938 per $100 of taxable net assessed value over the life of the bond and $.70 per $100 of taxable net assessed value the first year. The fact is – they will pay $.70 in the first year and then it climbs.
The tax rate climbs on a home valued at $120,693 is 0.0974 in 2016-217 and grows from there and in 2023-2024 it will be 0.5462 per $100 of taxable net assessed value.
Home values will likely climb as well, resulting in much more than the cost of a mere latte.
The debt retirement schedule in Table 2 below is only an estimate and relies on a number of assumptions.
- The schedule assumes that the taxable net assessed value of real property in Pima County will increase as prescribed in Arizona Revised Statutes § 35-454 (see column 2). 3.5% increase for 1st five (5) years and .7% thereafter,
- The general obligation bonds issued for the propositions will be sold according to the schedule shown in Table 1,
- That all bonds to be sold will have a 15-year final maturity, except for the $160,000,000 sold for road repair and pavement preservation, which will have a 10-year final maturity;that all bonds sold will carry an interest rate between 2.78 percent and 3.45 percent per year,
- The remaining $25,681,000 of debt authorized in previous elections is sold,
- There are no future voter-approved bond elections after 2015.
Totals excluded from the County’s schedule were total interest for each bond $84,058,430 and $203,332,227 as well as the total debt service for both bonds is $1,512,766,657.
To write it on a check would be One Billion, Five Hundred Twelve Million, Seven Hundred Sixty Six Thousand, Six Hundred Fifty Seven Dollars, and 0/100 cents.
Estimated Debt Retirement Schedule & Secondary Property Tax Rates
Table 2 Pima County Debt Retirement Schedule and Estimated Tax Rate Current and Proposed General Obligation Bonds
| All Seven Propositions Combined |
| Estimated Debt Retirement Schedule For Current Bonds Outstanding and Anticipated Future Sales 2 | Estimated Debt Retirement Schedule For the 2015 Proposed Bond Authorization | Total Estimated Debt Retirement Schedule for Current and 2015 Proposed Bond Authorization |
| Column 1 | Column 2 | Column 3 | Column 4 | Column 5 | Column 6 | Column 7 | Column 8 | Column 9 | Column 10 |
| Fiscal Year | Projected Taxable Net Assessed Value 1 | Principal | Interest | Projected Tax Rate per $100 Taxable Net Assessed Value 2 | Principal | Interest | Projected Tax Rate per $100 Taxable Net Assessed Value 3 | Total Debt Service | Projected Tax Rate per $100 Taxable Net Assessed Value |
| 2015-16 | 7,620,361,635 | 39,315,000 | 14,235,429 | 0.7000 | 53,550,429 | 0.7000 | |||
| 2016-17 | 7,886,822,820 | 43,285,000 | 13,307,145 | 0.7176 | 6,781,819 | 903,500 | 0.0974 | 64,277,464 | 0.8150 |
| 2017-18 | 8,162,601,354 | 45,792,500 | 12,038,068 | 0.7085 | 6,174,271 | 2,521,965 | 0.1065 | 66,526,804 | 0.8150 |
| 2018-19 | 8,448,023,035 | 44,115,000 | 10,458,799 | 0.6460 | 10,119,754 | 4,157,321 | 0.1690 | 68,850,874 | 0.8150 |
| 2019-20 | 8,743,425,057 | 46,092,500 | 8,944,795 | 0.6295 | 10,469,322 | 5,752,492 | 0.1855 | 71,259,109 | 0.8150 |
| 2020-21 | 9,049,156,401 | 41,540,000 | 7,343,158 | 0.5402 | 17,458,280 | 7,407,444 | 0.2748 | 73,748,882 | 0.8150 |
| 2021-22 | 9,112,437,152 | 42,877,500 | 5,801,714 | 0.5342 | 16,731,184 | 8,855,104 | 0.2808 | 74,265,502 | 0.8150 |
| 2022-23 | 9,176,160,425 | 31,125,000 | 4,121,976 | 0.3841 | 29,148,774 | 10,389,977 | 0.4309 | 74,785,728 | 0.8150 |
| 2023-24 | 9,240,329,314 | 21,955,000 | 2,883,755 | 0.2688 | 38,747,391 | 11,722,841 | 0.5462 | 75,308,988 | 0.8150 |
| 2024-25 | 9,304,946,937 | 14,800,000 | 2,033,014 | 0.1809 | 46,152,074 | 12,850,664 | 0.6341 | 75,835,752 | 0.8150 |
| 2025-26 | 9,370,016,431 | 15,397,500 | 1,427,278 | 0.1795 | 45,789,763 | 13,753,036 | 0.6355 | 76,367,578 | 0.8150 |
| 2026-27 | 9,435,540,956 | 11,125,000 | 790,703 | 0.1263 | 50,021,665 | 14,962,185 | 0.6887 | 76,899,553 | 0.8150 |
| 2027-28 | 9,501,523,694 | 7,152,500 | 403,076 | 0.0795 | 53,889,586 | 15,992,143 | 0.7355 | 77,437,304 | 0.8150 |
| 2028-29 | 9,567,967,849 | 2,220,000 | 142,376 | 0.0247 | 60,175,162 | 15,441,074 | 0.7903 | 77,978,613 | 0.8150 |
| 2029-30 | 9,634,876,648 | 1,516,000 | 78,493 | 0.0165 | 54,583,974 | 13,609,296 | 0.7078 | 69,787,764 | 0.7243 |
| 2030-31 | 9,702,253,341 | 865,000 | 36,349 | 0.0093 | 43,717,694 | 11,932,953 | 0.5736 | 56,551,996 | 0.5829 |
| 2031-32 | 9,770,101,198 | 442,500 | 12,302 | 0.0047 | 41,717,694 | 10,558,693 | 0.5351 | 52,731,188 | 0.5398 |
| 2032-33 | 9,838,423,516 | 41,595,699 | 9,240,032 | 0.5167 | 50,835,731 | 0.5167 | |||
| 2033-34 | 9,907,223,612 | 39,575,356 | 7,924,763 | 0.4794 | 47,500,119 | 0.4794 | |||
| 2034-35 | 9,976,504,826 | 37,221,689 | 6,665,660 | 0.4399 | 43,887,349 | 0.4399 | |||
| 2035-36 | 10,046,270,525 | 34,555,027 | 5,471,989 | 0.3984 | 40,027,016 | 0.3984 | |||
| 2036-37 | 10,116,524,094 | 32,051,027 | 4,352,450 | 0.3598 | 36,403,477 | 0.3598 | |||
| 2037-38 | 10,187,268,947 | 28,051,032 | 3,302,523 | 0.3078 | 31,353,555 | 0.3078 | |||
| 2038-39 | 10,258,508,519 | 23,717,689 | 2,380,596 | 0.2544 | 26,098,285 | 0.2544 | |||
| 2039-40 | 10,330,246,269 | 19,051,022 | 1,597,336 | 0.1999 | 20,648,358 | 0.1999 | |||
| 2040-41 | 10,402,485,681 | 14,384,355 | 963,409 | 0.1475 | 15,347,764 | 0.1475 | |||
| 2041-42 | 10,475,230,264 | 9,705,855 | 478,815 | 0.0972 | 10,184,670 | 0.0972 | |||
| 2042-43 | 10,548,483,549 | 4,172,842 | 143,963 | 0.0409 | 4,316,805 | 0.0409 | |||
| Total | 409,616,000 | 84,058,430 | 815,760,000 | 203,332,227 | 1,512,766,657 |
Table 2 shows the estimated schedule for retiring previously authorized general obligation bonds of Pima County including all previously sold and remaining authorized but unsold debt (see columns 3 and 4); the estimated schedule for retiring the new general obligation bonds for all seven propositions, assuming they are authorized and then sold in accordance with the estimated sale schedule (see columns 6 and 7); and the total estimated aggregate debt service for both existing and new bonds (see column 9). Table 2 also shows the projected secondary property tax rates that would be required to finance this debt retirement schedule (see column 5, 8, and 10).
Related articles:
Prop. 426 Could Be Pima County Debt Accelerator
Pima County Bond Beneficiaries Concerned With Funding Timeline
Tucson Medical Center Funding “Yes on Pima County Bonds”
Pima County Bond Election – Proposition 430
Pima Bonds Campaign Funders: Donors Or Investors?
Arizona Supreme Court Rejects Pima County Lawsuit, Huckelberry Demands Tax Increase